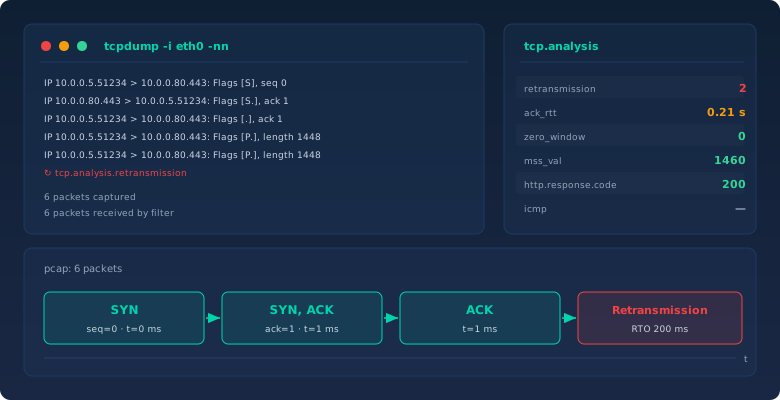
It was 7:41 on a Tuesday when the phone rang. Accounting had not been able to work with the ERP system since Monday evening, "the whole thing just hangs". I found nothing in monitoring: CPU at 20 percent, half the memory free, not a single red light on any dashboard. The application logs looked clean, and the database server dutifully reported four milliseconds for every request. Yet someone called every ten minutes, and I started doubting my own numbers instead of the network.
At nine I attached to the uplink from the core switch to the server VLAN and let it run for five minutes. Two minutes after opening the file in Wireshark, the case was closed: of 4,812 data packets heading for the ERP server, 61 had been sent a second time, and all of them from the same source group. The loss was not on the way to the server but on the way back, on the uplink between two switches. One port there was still running at 100 Mbit half duplex because of a leftover configuration, while its neighbour ran a full gigabit. No monitoring on earth would have reported this, because no device had raised an error counter. The capture showed it in two minutes.
Why a capture beats ten theories
When two people argue about a network problem, each has a theory and neither has data. Is it the firewall? The load balancer? That new update? A packet capture ends the argument, not because it answers the question but because it supplies the facts: which packets actually crossed the wire, at what size, with what timing and with which sequence numbers. Nobody lies on a cable. That makes a packet capture the one tool in an admin's kit that simply ignores vendor boundaries and departmental org charts.
Expectations matter here. A capture rarely tells you "the firewall is to blame". It tells you a SYN goes out and no SYN/ACK comes back. Whether that is the firewall, the server or a bad route is your decision, now with one hard fact in hand. That is exactly what happened above: the capture showed retransmissions in one direction only, and that pointed at an uplink rather than at the server.
Capture filters vs. display filters: two worlds, one classic mistake
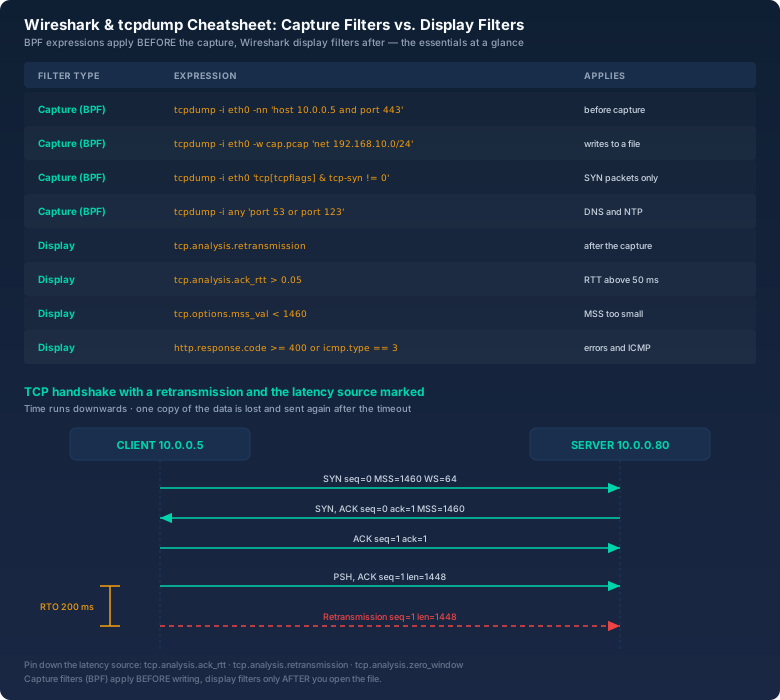
The most common mix-up in packet analysis happens at the very start. There are two completely different filter languages, and they act at completely different moments:
Capture filters are evaluated by the capture engine before a packet is written to disk or memory. The syntax is BPF, for Berkeley Packet Filter, the same language tcpdump speaks. Whatever a capture filter discards is gone for good — it never reaches the file and you cannot get it back. That is the upside (small files, low CPU load) and the risk in one.
Display filters are Wireshark syntax. They act on a file that already exists and simply hide what you do not want to look at right now. The packets are still there. If you realise you filtered wrong, you just edit the expression in the filter bar.
The classic mistake: you want to see only HTTP errors, so your capture filter throws away everything except port 80. Two hours later it turns out that DNS resolution was the real problem — except DNS is not in the file. The rule I follow is therefore: cut as coarsely as possible with capture filters, and as finely as needed with display filters. My capture filters almost always just narrow down by host or network, and Wireshark does the rest.
For address expressions it pays to know the network in advance. When you are unsure whether the mask in an expression like net 192.168.10.0/24 is right, the bitcalc Subnet Calculator settles it in seconds. Check the network address and the CIDR prefix once, and your tcpdump expression afterwards really catches the devices you meant.
tcpdump: five switches that cover the daily grind
tcpdump ships with every server, runs over SSH and needs no GUI. Five options cover about 90 percent of real cases:
-ipicks the interface, and-i anytakes everything. Without it tcpdump guesses, and it often guesses wrong.-nnturns off name resolution for hosts and ports. Without it tcpdump waits for DNS replies and quietly distorts your timings.-wwrites to a file instead of the console. This is the real professional mode, because only the file can be opened in Wireshark later.-rreads a saved file back in, so you can re-analyse without capturing again.-cstops after a fixed packet count, which is worth its weight in gold when you suspect a loop.
A typical invocation for the situation described above looks like this:
$ sudo tcpdump -i eth0 -nn -s 0 -c 5000 \
    'host 10.0.0.5 and port 443' -w /tmp/erp.pcap
tcpdump: listening on eth0, link-type EN10MB (Ethernet), snapshot length 262144 bytes
5000 packets captured
5000 packets received by filter
0 packets dropped by kernel
Two things in that output you should always read. First, 0 packets dropped by kernel. If that number is above zero, the kernel threw packets away because tcpdump could not drain the ring buffer fast enough. Your analysis now rests on sand, because the one packet that mattered is the one that is missing. Second, the snapshot length. Without -s 0, tcpdump truncates packets at 262144 bytes — harmless at modern MTUs, a problem with jumbo frames, and with some analysis tools the payload is simply gone.
The expression language itself is smaller than it looks. host 10.0.0.5 matches both directions while src host and dst host split them. net 192.168.10.0/24 groups a network, port 443 a service, and portrange 10000-10100 a range. You combine them with and, or and not, and parentheses belong inside quotes on the command line or the shell will eat them. If you only want to see connection attempts, a capture filter handles that too:
$ sudo tcpdump -i eth0 -nn 'tcp[tcpflags] & tcp-syn != 0 and tcp[tcpflags] & tcp-ack == 0'
14:22:07.914213 IP 10.0.0.5.51234 > 10.0.0.80.443: Flags [S], seq 3847291055, win 64240
The tcp-ack == 0 is the important half: it separates the plain SYN from the SYN/ACK. Without it you get both and can only tell them apart by squinting at the flags in the output.
Capturing without filling the disk
A capture on a busy uplink grows faster than most people expect. At 600 Mbit of throughput with full headers you collect gigabytes per minute without trying. So never capture blindly into a single file — capture into a ring buffer:
$ sudo tcpdump -i eth0 -nn -s 0 -w /var/tmp/cap-%Y%m%d-%H%M.pcap \
    -G 300 -z gzip
With -G 300 the output file rotates every five minutes, the time format in the filename keeps the files sortable, and -z gzip compresses each finished file afterwards. You always have the last few hours within reach and still never blow up a partition. The counterpart for files you already have is editcap from the Wireshark package:
$ editcap -c 50000 big.pcap small.pcap       # split into chunks of 50,000 packets
$ editcap -i 60 big.pcap minutes.pcap        # one new file per minute
$ capinfos big.pcap                          # time span, packet count, duration, throughput
capinfos is the underrated hero of preparation. In a single output it tells you over what period the file runs, how many packets it holds and what the average throughput was. Only then do you know whether your capture even contains the incident, or whether you missed the window by two hours. Before any long session in Wireshark I read capinfos first — it saves an astonishing amount of clicking around in the wrong file.
Wireshark: filter, don't scroll
Inside Wireshark it is not scrolling speed that solves the case, it is the filter bar. Above all other filters sit the analysis fields Wireshark computes itself as soon as a TCP conversation is complete in the capture:
tcp.analysis.retransmission        # packet was sent again
tcp.analysis.fast_retransmission   # quick resend after duplicate ACKs
tcp.analysis.ack_rtt > 0.05        # single-ACK RTT above 50 ms
tcp.analysis.zero_window           # receiver reports a full buffer
tcp.options.mss_val < 1460         # unusually small MSS in the handshake
http.response.code >= 400          # genuine error responses
icmp.type == 3 && icmp.code == 4    # fragmentation needed
These fields are Wireshark's estimates based on packet order, not a server's ground truth. That is precisely their strength: they surface patterns you would never spot by eye across 40,000 rows. On the command line the same display filter is available through tshark:
$ tshark -r erp.pcap -Y 'tcp.analysis.retransmission' -T fields \
    -e frame.time_relative -e ip.src -e ip.dst -e tcp.seq
Here -Y is the display filter and -f would be the capture filter. The distinction from earlier holds exactly the same way, just with different letters.
One limitation deserves an honest mention: with encrypted traffic you only see the envelope. What remains of a TLS stream is packet sizes, timing, flags and the handshake parameters — which is exactly what network diagnosis needs. You only get to read payload if you feed Wireshark a TLS key, and that requires access to the session key, which on a production server you generally neither have nor want. For the question "why is it slow" you do not need it anyway: a slow server answers slowly, a slow network delivers packets late. Both are visible on the encrypted envelope. If you type the same line thirty times, write a small shell script — and when the numbers keep growing, the bitcalc Download Time Calculator gives you a feel for how much longer the capture may run before the target disk fills up.
The handshake as a measuring tape
Before you say anything about latency, look at the first three packets of a connection. The handshake carries several values for free that explain everything afterwards:
In the SYN the client offers its MSS, the largest payload it can receive. Common values are 1460 on an Ethernet MTU of 1500, 1440 with the DF bit set, and 1380 or less through a VPN tunnel. The window scale option grows the receive window beyond the 16 bits the TCP header field offers; without it, 64 KiB is the ceiling. And the time between the SYN and the client's ACK is your first, very honest RTT measurement, taken before a single byte of payload has flowed.
Compare those three values between two servers and you will find the cause of a "slow application" surprisingly often, without reading a line of application code. A small MSS in the handshake almost always means a tunnel or a middlebox with a smaller MTU is in the path. That whole class of problems is covered in MTU, MSS & Jumbo Frames; here it is enough to say the capture shows you the small MSS, and that article explains why.
Reading retransmissions: loss, reordering or duplicate
A retransmission is not a verdict, it is an observation. Wireshark flags a packet as a repeat when it sees a sequence number it has already seen in that data stream. Three causes are common, and they look clearly different in a capture:
- Real loss: after the original there is a stretch of nothing, then the repeat arrives at roughly the RTO. Typical values here start around 200 milliseconds and go up, because that is the Linux minimum. The cause is a congested segment, a failing uplink or a full buffer somewhere along the path.
- Fast retransmit: the sender resends as soon as three duplicate ACKs arrive, far earlier than after a timeout. Wireshark labels this
fast_retransmission. It is the stack behaving normally and only means one packet went missing — no alarm required. - Reordering: packets arrive in a different order than they were sent. The client sees a number too early and fires a duplicate ACK, but the resend resolves itself. The usual culprit is a link aggregation bundle without flow affinity.
You tell the three apart by looking at the gap between original and repeat. A few milliseconds with three duplicate ACKs in front: fast retransmit. Around 200 milliseconds with silence before it: real loss with a timeout. Order scrambled but the repeat nearly simultaneous with the original: reordering. That reading matters far more than the absolute count. One percent of retransmissions spread evenly across all streams is a load problem; a single stream with fifty percent retransmissions is a path problem.
Separating latency sources
When a user says "slow", they almost always mean one of three things, and a capture can tell them apart. The first source is the transport path: RTT, retransmissions, reordering. The second is the receiver, visible as a zero window when the application does not read from its socket fast enough or the buffer is full. The third is the application itself, meaning the time between the last data packet of a request and the first response packet from the server.
For the first source, use tcp.analysis.ack_rtt, which Wireshark computes for every ACK. For the second, filter on tcp.analysis.zero_window and you immediately find the connections that ran under memory pressure. For the third, mark the last data request in Wireshark and jump to the first response packet with set/next time reference — the difference shown is the server's think time, and it is sometimes remarkably large. I have seen customer cases where 830 of 900 milliseconds of response time belonged to the application and only 70 to the network. Without that separation you argue with the network team for days about a problem that lives in a database query.
VPN and MTU traps in the capture
Captures across VPN links are especially instructive and especially tricky. On the VPN interface you see encrypted packets with their own length; on the LAN interface next to it, the payload is already unwrapped again. If you measure latency on one side but not the other, you have just proven that the tunnel itself is the cause — aggregation, encryption and the WAN path are visibly separated there.
Two classics in this area. First: a user working from home reports slow downloads while everything is fine in the office. The capture at the server shows normal RTTs, the capture at the client shows large ones. Only the tunnel sits between the two, so the WAN path is the bottleneck, not the server. Second: the smaller MSS in the handshake mentioned earlier, in environments that push it via DHCP option 140, where one data centre sets a different value per side. To understand those MTU fundamentals, the article linked above is the right place. For the checkable result, look at actual packet sizes in the capture: a data packet of 1448 bytes on a 1500 link is normal, one of 1352 bytes betrays a tunnel with a 1400 MTU.
Privacy: how long may a capture sit around?
A capture is a collection of personal data the moment user traffic is in it. You can see visited websites, sent mail headers and, with unencrypted traffic, actual content. In Germany that is explicitly a case for a data protection impact assessment, and retention is the practical problem. The rules I run customer systems by:
- Tie the purpose to a timeframe. A capture exists to analyse an incident and is deleted once the incident is documented. I put the date in the filename rather than in a separate list that I will not find again.
- Set deadlines and automate them. A deletion job is more reliable than discipline. Capture files leave our working directory after 30 days; the documented cause stays, the file does not.
- Capture only as broadly as needed. A capture filter on one host and one port not only produces a smaller file but also less privacy exposure. This is the pleasant case where clean craft and compliance want the same thing.
- Restrict access. Capture files belong on servers only the admin team can reach, not in a shared folder. When I pass a file on, I do not pass the raw capture — I pass an extract containing the relevant packets.
That last point has a pleasant side effect: a 30-packet extract trimmed to two seconds is much easier for the person reading your ticket than a megabyte file. Privacy, it turns out, makes the analysis more usable on the way.
The toolbox for the drawer
If you want all of this in a workable order, this sequence almost always works for me:
- Sharpen the question: one sentence is enough. "Data packets arrive twice between the client and the server."
- Capture coarsely: correct interface,
-nn, onehostornetexpression, straight into a file. No port-soup in the capture filter. - Look at the file first:
capinfosfor time span and volume, then find the handshake of an affected conversation in Wireshark. - Read the handshake: MSS, window scale, first RTT. Those are your three baseline values.
- Apply display filters:
tcp.analysis.retransmission, thenack_rtt, thenzero_window. One at a time, or you will see nothing. - Use a time reference: mark the last request, look at the first response, separate think time from network time.
- Save the result: the trimmed extract into the ticket, the raw file deleted when its deadline passes.
For the address and network questions in step two I regularly reach for the Subnet Calculator, because a mis-computed net in a capture filter means you spent an hour filtering nothing. And when the capture needs to run long, the Download Time Calculator gives you a feel for the data volume before the partition fills up.
Bottom line
Packet analysis has a reputation among admins as the last resort for when nothing else works. It is the opposite: the cheapest tool for the question of where the truth actually lies. A capture starts in thirty seconds, needs no licence, no agent on the target system and no approval from a vendor. It takes away the excuses of whatever device is in the way and produces numbers people can argue about.
What you actually need is astonishingly little: the distinction between capture and display filters in your head, tcpdump -i -nn -w on a server, Wireshark with those four tcp.analysis fields, and the willingness to treat the handshake as a measuring tape. The rest is practice. The ERP case cost five minutes of analysis once I finally had data, and two hours back when I was still guessing. Since then my rule is simple: capture first, argue later.