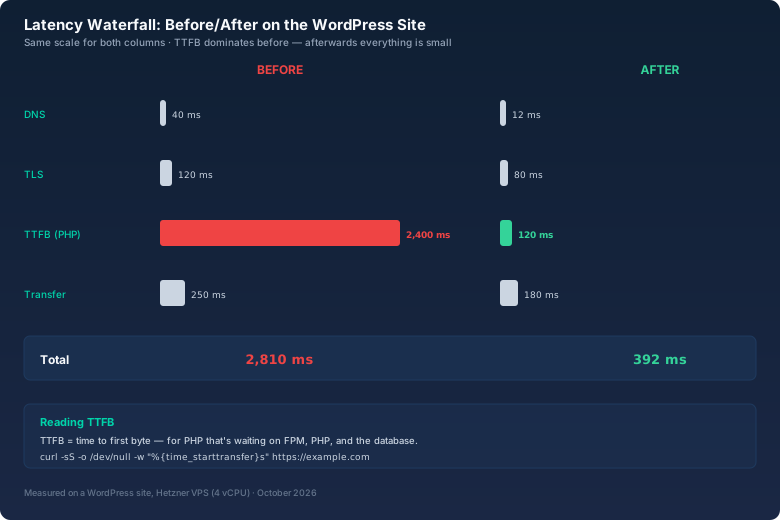
Three years ago a client called me because his WordPress shop was "just too slow". He wanted to buy a new server — more CPU, more RAM, double the performance. I measured first, before he spent any money: the homepage took 2.8 seconds to the first byte (TTFB). The server was 90 percent idle. The problem wasn't hardware but a configuration nobody had touched since installation: PHP-FPM ran with defaults, opcache was off, and nginx compressed nothing. Two hours later the page was at 180 milliseconds TTFB — on the same server, without spending a cent.
This article shows the complete before/after tuning with concrete values: first measure and understand where the time goes, then size PHP-FPM properly, enable opcache, and explain the nginx directives nobody questions anymore.
Measure first: where does the time go?
Before any change comes measurement. Anyone who flips directives blindly is guessing. The most important tool is curl with write-out — I showed it in the curl article, and here it goes to work:
curl -sS -o /dev/null -w \
  "DNS: %{time_namelookup}s\nTCP: %{time_connect}s\nTLS: %{time_appconnect}s\nTTFB: %{time_starttransfer}s\nTotal: %{time_total}s\n" \
  https://example.com
The output on that slow WordPress site back then:
DNS:   0.041s
TCP:   0.058s
TLS:   0.121s
TTFB:  2.390s   ← the problem lives here
Total: 2.640s
The lesson: DNS, TCP, and TLS together take 220 milliseconds — that's normal. The remaining 2.4 seconds are TTFB: the time the server needs until it sends the first byte of the response. For a PHP page that means: nginx waits for PHP-FPM, PHP-FPM waits for PHP, PHP waits for the database. That's exactly where the tuning had to start, not with buying a server.
PHP-FPM: calculate the workers properly
PHP-FPM keeps a number of worker processes ready to execute PHP scripts. The most important setting is pm.max_children — the maximum number of concurrent workers. Too few workers: requests queue up and the page gets slow. Too many workers: the server collapses because every worker eats RAM and the system starts swapping.
The calculation is simple math:
# A PHP worker typically needs 30–60 MB of RAM for WordPress
# Server: 4 GB RAM, 3 GB reserved for PHP
# 3 GB / 50 MB = 60 workers

pm = dynamic
pm.max_children = 60
pm.start_servers = 10
pm.min_spare_servers = 5
pm.max_spare_servers = 15
pm.max_requests = 1000
The dynamic model starts with 10 workers and scales as needed between 5 and 15 spare ones. If you want to save memory, use ondemand — workers only start when a request arrives and die after pm.process_idle_timeout. For heavily frequented sites, static with fixed workers is fastest because there's no start/stop overhead — but it costs permanent RAM. On a 2-GB VPS with WordPress I start with dynamic and 30 workers, measure, and adjust.
The RAM calculation is where the bitcalc IOPS Calculator comes into play — not for the workers, but for the foundation: once your server starts swapping, IOPS drop dramatically and every PHP request becomes a test of patience. If your logs, database, or sessions sit on a slow disk, the IOPS calculator shows you immediately why the numbers don't add up — and whether an SSD is the answer before you buy more expensive hardware.
pm.max_requests: against the silent memory leak
PHP scripts leak memory. Not always intentionally, but every library, every plugin, every faulty call leaves a few kilobytes behind. Over weeks, a worker grows from 40 MB to 200 MB — and nobody notices until the server swaps.
The fix is pm.max_requests = 1000: after 1000 handled requests, the worker is cleanly terminated and a fresh one starts. That costs nothing (the restart takes milliseconds) and prevents the classic "site gets slower over weeks" curve. For WordPress with its many plugins, this is the most important preventive setting of all.
opcache: the forgotten turbo
PHP recompiles every script to bytecode on every call. For WordPress with 200 files per request, that's a significant part of the response time. OPcache stores the compiled bytecode in RAM — after that, PHP skips compilation entirely.
The shocking part: on many servers, opcache is simply off or on defaults designed for small scripts. Here's a sensible setup for WordPress:
; /etc/php/8.3/fpm/conf.d/10-opcache.ini
opcache.enable = 1
opcache.memory_consumption = 128
opcache.interned_strings_buffer = 16
opcache.max_accelerated_files = 10000
opcache.validate_timestamps = 1
opcache.revalidate_freq = 2
The two values that are almost always too small for WordPress: memory_consumption (128 MB instead of 64) and max_accelerated_files (10,000 instead of 4,000). If you want to know whether the cache is full, query the status page:
php -r 'var_dump(opcache_get_status()["memory_usage"]);'When used_memory is close to free_memory, raise the value. In my client's case, opcache was completely off — enabling it alone halved the TTFB.
nginx: the directives without magic
Now the nginx part. Three things make the difference for PHP sites: setting workers correctly, offloading static files, and enabling gzip. The directives at a glance — as a table with honest effects instead of myths:
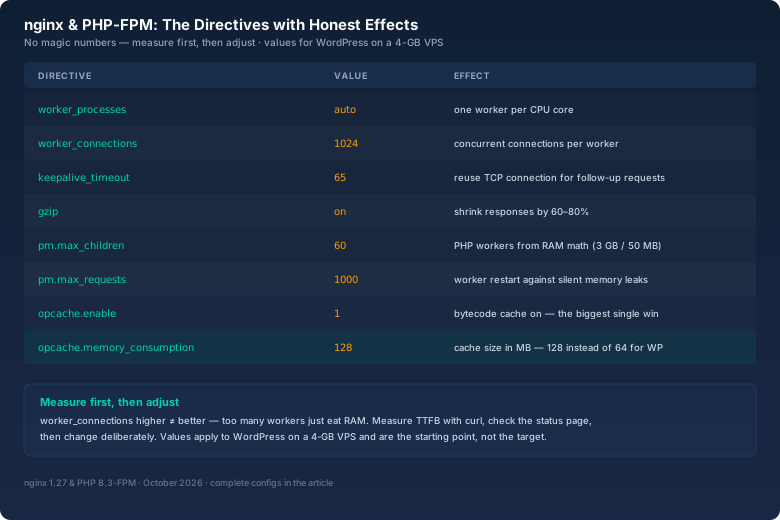
Three things from the table deserve their own explanation:
worker_processes = auto starts one worker per CPU core. That's the right choice for almost all cases — nginx workers are I/O-bound and benefit from more cores, but more workers than cores buys nothing. worker_connections = 1024 is not a magic number: it limits concurrent connections per worker, and with modern keepalive it's plenty for most sites. Anyone who believes "higher = better" here only creates unnecessary memory usage.
gzip on is the invisible accelerator: HTML, CSS, and JSON get compressed before transfer, typically saving 60 to 80 percent of volume. That hits the transfer time directly — and if you've used the bitcalc Download Time Calculator before, you know how much a line gains from fewer bytes. The same applies to JSON API responses: gzip on, and answers arrive faster than the client can process them.
keepalive 65 and keepalive_requests let the client reuse the TCP connection for multiple requests. A browser loading 80 static files saves the TLS handshake per file that way — with HTTP/2 that's organized differently automatically, but for HTTP/1.1 clients and API consumers, keepalive is the difference between 80 handshakes and one.
The PHP-FPM status page: the dashboard nobody knows
PHP-FPM has a built-in status page that shows you in real time what the workers are doing:
# Enable it in the pool config
pm.status_path = /status

# Expose it in the nginx server block
location = /status {
    access_log off;
    allow 127.0.0.1;
    deny all;
    fastcgi_pass unix:/run/php/php8.3-fpm.sock;
    include fastcgi_params;
}
Then curl http://127.0.0.1/status?full returns values like active processes, max children reached, and max listen queue. The most important metric: if max children reached is regularly above 0, you've configured too few workers — requests queue up and the page gets slow. And if the listen queue grows while workers are free, something is wrong with the connection between nginx and FPM. That one page has saved me more tuning evenings than any documentation.
The security screw: Basic Auth with htpasswd
A side track that's often forgotten during tuning: staging environments and admin areas that shouldn't be public get secured at nginx with two lines:
# Create the htpasswd file (generate the password with the bitcalc Password Generator)
htpasswd -c /etc/nginx/.htpasswd admin

# In the nginx server block
location /staging {
    auth_basic "Restricted";
    auth_basic_user_file /etc/nginx/.htpasswd;
}
That's Basic Auth — the same mechanism as curl -u from the curl article: username and password Base64-encoded in the header, so only use it over HTTPS. For password generation I use the bitcalc Password Generator — 32 characters, all classes, and into the password manager.
The result: 2.8 seconds down to 392 milliseconds
In summary, the tuning session on the client's WordPress site looked like this:
- Enable opcache (it was off): TTFB from 2.4 s to 1.1 s — the biggest single win.
- PHP-FPM from defaults to dynamic/60 workers with max_requests=1000: TTFB to 320 ms, no more queueing.
- gzip on and keepalive: transfer time from 250 ms to 180 ms.
- opcache to 128 MB / 10,000 files: TTFB stabilized at 120 ms.
The page now loads completely in about 400 milliseconds, TTFB at 120 to 180 ms. The client didn't buy a new server. The old hardware was enough — and still is today.
Bottom line
Web server tuning isn't magic, it's measuring and calculating. The three biggest levers for PHP sites are always the same: enable opcache and size it properly, adapt PHP-FPM workers to your RAM instead of keeping defaults, and turn on gzip plus keepalive in nginx. If you also know the latency waterfall, you'll know where the time goes before every change — and won't waste a night on directives that do nothing.
The client from back then still calls when his site is "slow". Usually it's a plugin update, a full cache, or a database without an index. The hardware was never the problem — and that's the best news an admin can get.