
In October I pulled an SSD out of a client's NAS that still had 96 percent of its life ahead of it according to SMART. Three months later it was dead. Not slowly dying, not with a warning — dead. The server started throwing write errors, the filesystem flipped to read-only, and the post-mortem showed what I should have checked earlier: the 96 percent was the consumption of P/E cycles, and that was low because the controller redistributed cleverly. What sat next to it, and that nobody had looked at, was the volume of bytes actually written. It was above the manufacturer's TBW rating.
That is where all the confusion about this topic hangs. A percentage without a reference quantity is not a lifespan forecast, it is a data point. This article is the calculation I have run ever since, before an SSD goes anywhere.
What SMART really counts
The value Windows, your NAS web interface or smartctl shows as Life Left or Percentage Used comes from one of two paths, and both have a limit.
The first path counts P/E cycles. Every erase operation wears a flash block, and the controller tracks how often each block has been written and erased, weighted across all blocks. The ratio of consumed to specified cycles produces the percentage. That is honestly computed, but it describes only the NAND, not the work the host imposes on it. That is exactly why an SSD with 96 percent remaining can die: if the write load is high enough to hit the specified total write volume while the P/E cycles still have headroom, the figure is correct — and still misleads you about remaining runtime.
The second path comes from drives that no longer maintain P/E data cleanly and estimate consumption from bytes written. Both paths tell you the same thing at heart: the interesting number is not the percentage, it is the volume written compared with the specification.
TBW, DWPD, PBW — three names for the same quantity
All three describe how much write volume an SSD tolerates before the manufacturer ends the warranty. They are expressed differently because they target different audiences.
TBW — Total Bytes Written
TBW means you may write this many terabytes. A 1 TB consumer SATA SSD typically carries 600 TB of TBW. A 2 TB NVMe sits at 1,200 TB, a 1.92 TB enterprise drive at 3,500 TB or more. The value lives in the datasheet, not on the box, and it is the basis for everything else.
DWPD — Drive Writes Per Day
DWPD is the figure that comes out of the data centre: how often may you overwrite the drive's full capacity per day, averaged over the warranty period? A DWPD of 1 on a 1.92 TB SSD means 1.92 TB per day, for the warranty term. The advantage of this unit is that it bakes in capacity — which is why enterprise drives are comparable in DWPD and consumer drives are not.
Converting between the two is where I most often see people compare two numbers that mean the same thing. The formula is:
DWPD = TBW ÷ (capacity in TB × warranty years × 365)
For the 1 TB consumer drive with 600 TB and five years of warranty, that gives 600 ÷ (1 × 5 × 365) = 0.33 DWPD. For the 1.92 TB enterprise drive with 3,500 TB: 3,500 ÷ (1.92 × 5 × 365) ≈ 1.0 DWPD. So the enterprise drive writes three times as much per unit of capacity — and costs accordingly. Run it the other way and you get PBW back from DWPD: 1.92 TB × 1 DWPD × 5 years × 365 = 3,504 TB ≈ 3.5 PB.
Whoever writes PBW means the same thing in petabytes. Above 1,000 TB that is the friendlier unit, but do not confuse it with the size of the drive: an SSD with 4 TB of TBW is not 4 TB in size, it is 1 TB and may write 4 TB. That is the classic datasheet misunderstanding.
Write amplification: why the SSD writes more than you do
When you write 100 GB to an SSD, more than 100 GB lands in the NAND. Before writing, the controller must erase whole blocks, and it must reshuffle data when only part of a block changed. The ratio of bytes actually written to flash versus bytes requested by the host is called the Write Amplification Factor, or WAF. It sits near 1 in the good case and at 4 or more in the unpleasant one.
Three things push the WAF up, and all three are everywhere in practice. First, small random writes: a database working in 4 KB blocks forces constant reshuffling. Second, missing TRIM: if the controller is not told which areas are free, it keeps carrying them along. Third, workloads that were never meant for flash: logs appended continuously, swap, or a ZFS SLOG on a consumer drive that was never built for it.
For lifespan this means the TBW rating refers to bytes landing in the NAND, not the bytes you send from the host. Calculate with the WAF, not without it — otherwise the drive lasts half or a quarter as long as your estimate.
The calculation I actually run
Before an SSD goes into a server, I estimate three numbers: the daily write load from the host, the expected WAF and the TBW rating. The first two produce the load in the NAND, and the lifespan follows from the division.
Estimating the daily write load is the hard part, because it is rarely obvious. On a backup server it is the volume of the backups. On a database host it is harder to grasp, because it depends on the transactions: one write operation per record, often in small blocks. That is exactly what I use the IOPS calculator for: if I know how many write IOPS a workload generates on average and how large the blocks are, I get the bytes per day. From 200 write IOPS at an average of 8 KB per access, that is roughly 138 GB per day — 50 TB per year, and with a WAF of 2.5 that is 126 TB per year in the NAND.
Run that across three drives and it immediately becomes clear why the choice of SSD matters more than the choice of server.
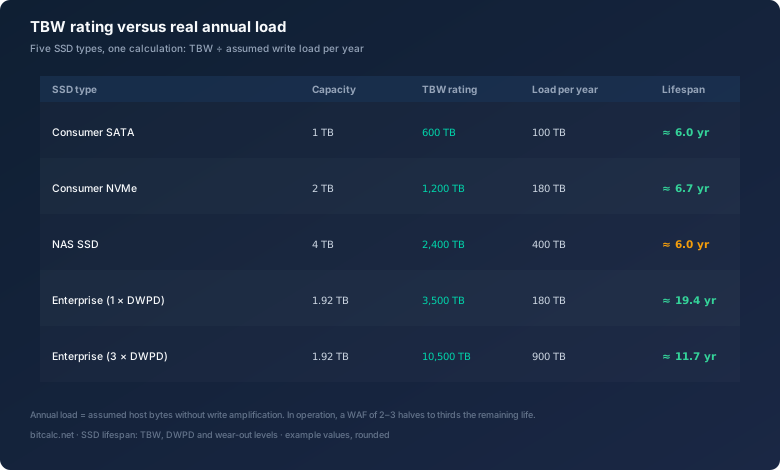
The numbers in the table are deliberately rounded and calculated against an annual load. But they show the pattern: the same load brings a consumer drive to its TBW limit after six years and an enterprise drive not after nineteen. The difference between them is not the cell technology, it is the specification the manufacturer stands behind for the warranty term.
Reading wear-out values correctly
The NVMe SMART log contains several values that together form a picture, and it pays not to look at them in isolation. The most telling is Data Units Written: the volume actually written to the NAND, in units of 1,000 × 512 bytes. Divided by the TBW rating, it yields a percentage closer to the truth than any Life Left figure.
Next to it sit Percentage Used (consumption as the controller estimates it), Available Spare (reserve blocks held for wear levelling) and Media Errors (read errors corrected by redundancy without you noticing). Important to know: no two vendors count identically. A drive written off at 100 percent Percentage Used often keeps running because the spare blocks take over — and a drive reporting 0 percent while being written past its TBW can still fail suddenly. I have seen both extremes.
The pragmatic approach: put Data Units Written against TBW, watch Percentage Used and Available Spare over time, and raise an alert before the values go red. What to do when a drive fails is covered in detail in my article on SMART values, because the SSD is not the only component that gives notice beforehand.
Which workloads really kill an SSD
From five years of server operations I can name the write-intensive cases that reliably consume drives — and they are almost always the same ones.
Logging comes first. A service that writes a line per request can produce astonishing volumes per day. Databases with small transactions come second, because they not only write a lot but reshuffle a lot. ZFS comes third: an SLOG for the ZIL is one of the classic traps, because it is hammered hardest exactly when load is highest — and if it sits on a consumer SSD without power-loss protection, it becomes a devastating weak point. That boundary belongs to the storage-tiering question; what belongs where is in Storage Tiering.
Fourth comes the classic I have lived through myself: the cache. An L2ARC or a cache drive that gets forgotten over the years. It does not write spectacular volumes per second, but it writes constantly, and constant over three years is deadly.
What actually lowers the load
There are three measures that make a real difference and three that only work on paper.
What helps is, first, TRIM. On Linux that is the nightly fstrim run or a discard=async on modern filesystems; both let the controller know what has been deleted and lower the WAF. Second, the right drive in the right place: the SLOG belongs on an enterprise SSD with power-loss protection, not on the cheapest NVMe. Third, monitoring that makes consumption visible over time — an SSD whose wear you cannot see is an SSD whose failure you will not see coming.
What does not help is chasing capacity alone: an 8 TB consumer drive does not automatically carry more TBW per capacity, usually the same value per TB. Nor does it help to talk down the wear-out level by reading the percentage instead of the bytes written. And the third misconception is the belief that RAID protects against wear — it does the opposite, because every parity calculation creates additional writes. What RAID protects against is covered in the RAID in practice article; for lifespan the key point is that the load per drive does not fall with the number of drives, it rises.
Conclusion
The drive in the client's NAS was not a Monday model and did not die from a manufacturing defect. Over three years it did exactly what it was asked to do, and at some point it hit the limit written in the datasheet — it was just that nobody had compared that limit against the actual load.
The lesson is an order I have followed ever since. First read the TBW rating, then estimate the daily write load, then add the WAF, then pick the drive. Anyone who does those four steps before ordering will not later replace a drive they could have replaced in time. And looking at the bytes written instead of the Life Left percentage costs nothing but a minute per month.