
Three months ago I put Prometheus and Grafana on a Raspberry Pi 4. Twelve hosts, a node_exporter on each, a 15 second scrape interval, 15 days of retention. The question that has followed me since: what does this actually cost? Not in euros, in RAM, disk and nerves. Short answer: less than any cloud monitoring contract, but more than most blog posts will tell you.
This article does the full math. With real series numbers from my 12 hosts, not vendor slides. By the end you will know how big your Prometheus really needs to be, when the honest answer to "more metrics!" is plain overengineering, and why 20 metrics per host is a good starting point.
The Setup: 12 Hosts and a Raspberry Pi
The setup is unglamorous: three small VMs, four Raspberry Pis around the house, five older servers in the basement. Twelve machines in total, most on Ubuntu, two on Debian, and one NVR system I prefer to keep an eye on. Every host runs the node_exporter on port 9100, and the firewall only lets the monitoring host through.
Prometheus itself lives on the Pi 4 with 4 cores and 8 GB of RAM, writing to a small USB SSD. The SD card is too risky for a TSDB, I learned that after the third corrupted filesystem.
Here is the part nobody puts in the blog posts: the node_exporter ships hundreds of metrics per host by default. If you take all of them, you are at 2,000+ series in no time, just to see whether your machines are breathing. My rule after a few weeks of experimenting: 20 metrics per host. CPU, RAM, disk per mount, network in and out, load average, uptime. The rest is noise.
What One Metric Actually Costs
Start with the basic unit, the series. A series is a metric name plus a set of labels, like node_cpu_seconds_total with the labels instance, cpu and mode. At a 15 second scrape interval, each series produces four samples per minute, 240 per hour, 5,760 per day.
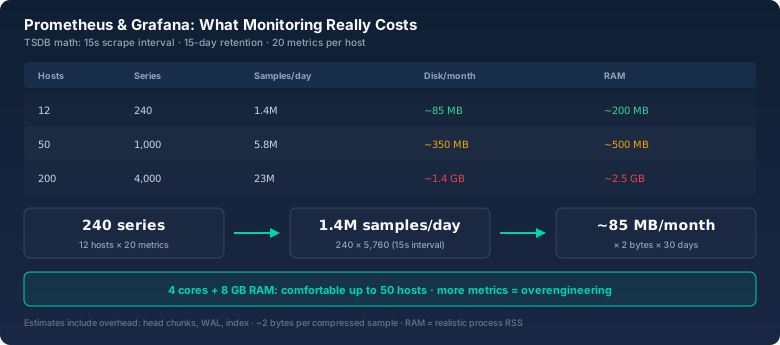
Twelve hosts times 20 metrics gives 240 series. That works out to 240 times 5,760, or about 1.4 million samples per day. Sounds like a lot, until you see the next number: Prometheus compresses samples into chunks and needs roughly 2 bytes per sample on average. 1.4 million samples times 2 bytes is 2.8 MB per day. At 15 days of retention you land at around 42 MB for the data itself.
On top of that come head chunks, the WAL and the index. In practice my Prometheus shows about 90 MB on disk after three months of running, roughly double the raw data. If someone tells you monitoring eats terabytes: that only starts at a few million series.
# The math for 12 hosts:
240 series × 5,760 samples/day = 1,382,400 samples
1,382,400 × 2 bytes = 2.8 MB/day
× 15 days retention = ~42 MB TSDB
+ WAL, head, index = ~60-100 MB total
And RAM? Here is the surprise: the metrics themselves are nearly free. The Prometheus process has a baseline cost of around 150 MB, whether you scrape 10 series or 1,000. Go runtime, index cache, query engine, all of that is fixed. With my 240 series the process sits at about 200 MB RSS. Only from a few thousand series up does memory start to scale noticeably.
prometheus.yml: Scrape Lean
The whole trick lives in the scrape config. My prometheus.yml is deliberately short, and the hosts are static targets because the list rarely changes. You can always add service discovery over DNS or Consul later, when it hurts.
global:
  scrape_interval: 15s
  evaluation_interval: 30s

scrape_configs:
  - job_name: "node"
    static_configs:
      - targets:
          - "vm01:9100"
          - "vm02:9100"
          - "vm03:9100"
          - "pi01:9100"
          # ... up to host 12
    relabel_configs:
      - source_labels: [__address__]
        regex: "([^:]+):.*"
        target_label: instance
The relabel_configs block is not decoration: without it Prometheus stores the full address including port as the instance label. With the regex you get clean hostnames, and your queries stay readable. Small details like this decide whether your dashboard is still fun after two months.
Recording Rules: Move the Math Out of Queries
The second lever is recording rules. Instead of running the same expensive query on every dashboard load, you let Prometheus compute it once per minute and store the result as its own series. That takes real pressure off the query engine, especially when Grafana refreshes every few seconds.
# rules.yml
groups:
  - name: node.rules
    rules:
      - record: node:cpu_usage_ratio
        expr: |
          1 - avg(rate(node_cpu_seconds_total{mode="idle"}[5m]))
            by (instance)
      - record: node:memory_usage_ratio
        expr: |
          1 - node_memory_MemAvailable_bytes
            / node_memory_MemTotal_bytes
A note I only admitted to myself after a month: every recording rule creates a new series and costs storage too. Two or three well-chosen rules are gold. Twenty rules for every conceivable metric is overengineering again, just under a different name.
Grafana: Datasource, Dashboards, and the JSON Test
Grafana itself is nearly invisible when it comes to storage. The dashboards sit on disk as JSON files, the metadata lives in a small SQLite database. What matters is the datasource configuration, so Grafana knows where to ask.
# grafana/provisioning/datasources/prometheus.yml
apiVersion: 1

datasources:
  - name: Prometheus
    type: prometheus
    url: http://localhost:9090
    access: proxy
    isDefault: true
When I want to check that everything runs clean, I do not ask Grafana first. I hit the Prometheus API directly. One curl against the query endpoint tells you in a single line whether your hosts are there:
curl "http://localhost:9090/api/v1/query?query=up"What comes back is JSON with the status of your whole setup, and this is exactly where the JSON Formatter from bitcalc helps: the API answer is one long wall of text, and once formatted you can see at a glance which host is down. Monitoring and JSON belong together.
The Honest Conversation: More Metrics Is Often Overengineering
The most common sentence in monitoring chats is "we need more metrics!" Most of the time it is not true. Most of the time what is missing is not a metric but a question you cannot answer with the data you have. And then the fix is a query, not a new metric.
My starting point after the experiments: 20 metrics per host. CPU usage, free RAM, disk usage per mount, network in and out, load average, uptime. That is enough to build 95 percent of the alerts you actually need. Everything else gets added when a real question demands it, not because the exporter offers it.
What you can safely skip: the process_ metrics of the node_exporter, per-CPU breakdowns you never look at, and filesystem series for every tmpfs. Decluttering halved my series count and not a single dashboard went dark.
Then there is the cardinality trap. More labels mean more series, and multiplicatively. instance, job, device and mountpoint are plenty as labels. Anyone who writes build_version or user_email into metric labels is building a storage problem that will only become visible in six months.
Where the 4-Core Box Hits Its Limits
At 12 hosts the Pi is simply bored. Prometheus uses a fraction of a percent of CPU, and Grafana only refreshes when you need it. At 50 hosts, or 1,000 series, it gets interesting: about 350 MB of disk per month and a process around 500 MB of RAM. That still fits comfortably on the box.
At 200 hosts and 4,000 series the picture changes: 1.4 GB of disk per month, the process hanging around 2.5 GB of RAM, and the first queries turn sluggish. At that point you start asking about longer retention, about VictoriaMetrics or Thanos, or about the honest insight that you do not need to keep every metric for 15 days.
Here is the thing though: the problem is almost never the disk. It is cardinality and query load. A dashboard with 20 panels refreshing every 5 seconds pushes a small server harder than 4,000 well-behaved series. Monitor your queries, not just your hosts.
Bottom Line
Monitoring costs less than the vendors want you to believe, as long as you scrape lean. A Prometheus on four cores with a 15 second interval and 15 days of retention is a matter of a few hundred MB of RAM and a handful of GB per year for a dozen hosts. Any mini server can do that on the side.
Start with 20 metrics per host, watch your cardinality, and add metrics only when a question really demands it. And when you have to read the JSON from the Prometheus API: the JSON Formatter turns the wall of text into a readable answer. Monitoring should take work off your plate, not add to it.